Reports
Last updated 5 months ago
The Reports is a premium addon included with the Studio subscription, or as an extra with a Pro subscription.
The Reports Page is a powerful data visualization tool designed for Coordinators, Supervisors, and Producers. It allows you to distill complex project data, such as task statuses, published versions, and folder priorities, into clear, actionable charts and infographics. This helps in assessing project progression, workflow efficiency, and productivity at a glance.
Note: Reports are currently available at the project level only. You must navigate to a specific project to access the Reports tab. Support for studio-level reporting across all projects is planned for the future.
Data Initialization
When the very first user accesses the Reports page for a project, the system must initialize the data. This process collects events and transforms them into report-ready data, particularly for time-based metrics.
This may cause a wait time of a couple of minutes for the first user.
Once initialized, this process does not need to be repeated for subsequent visits.
Dashboard Configuration
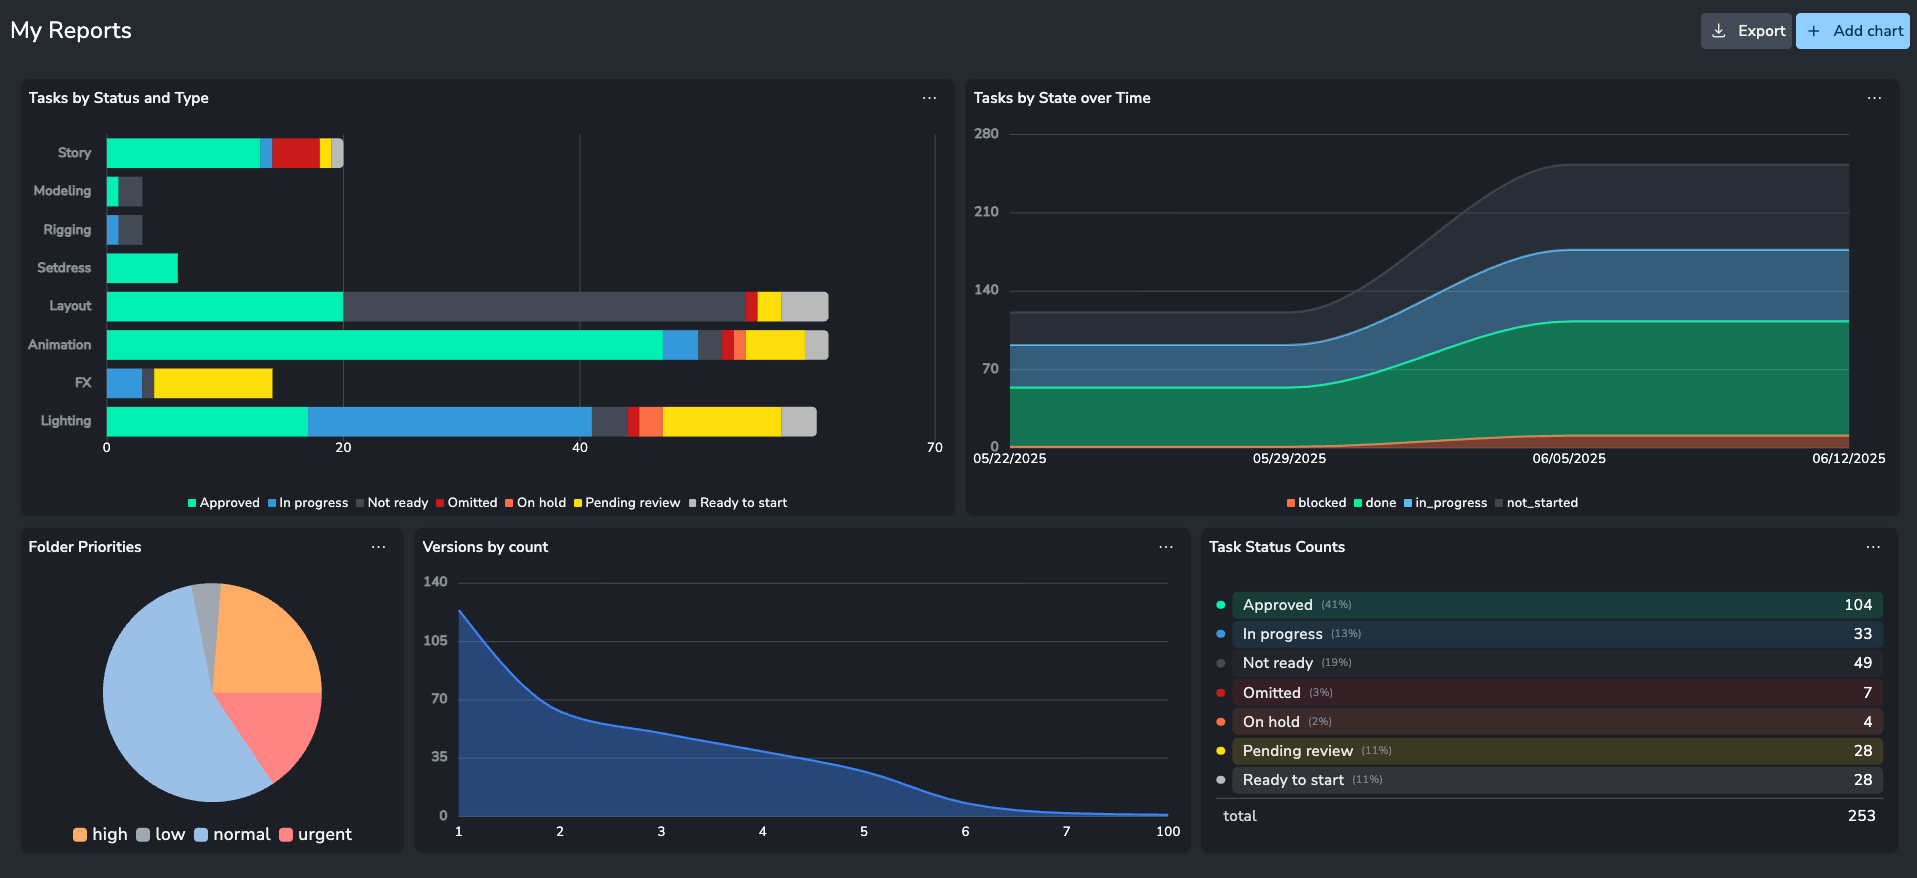
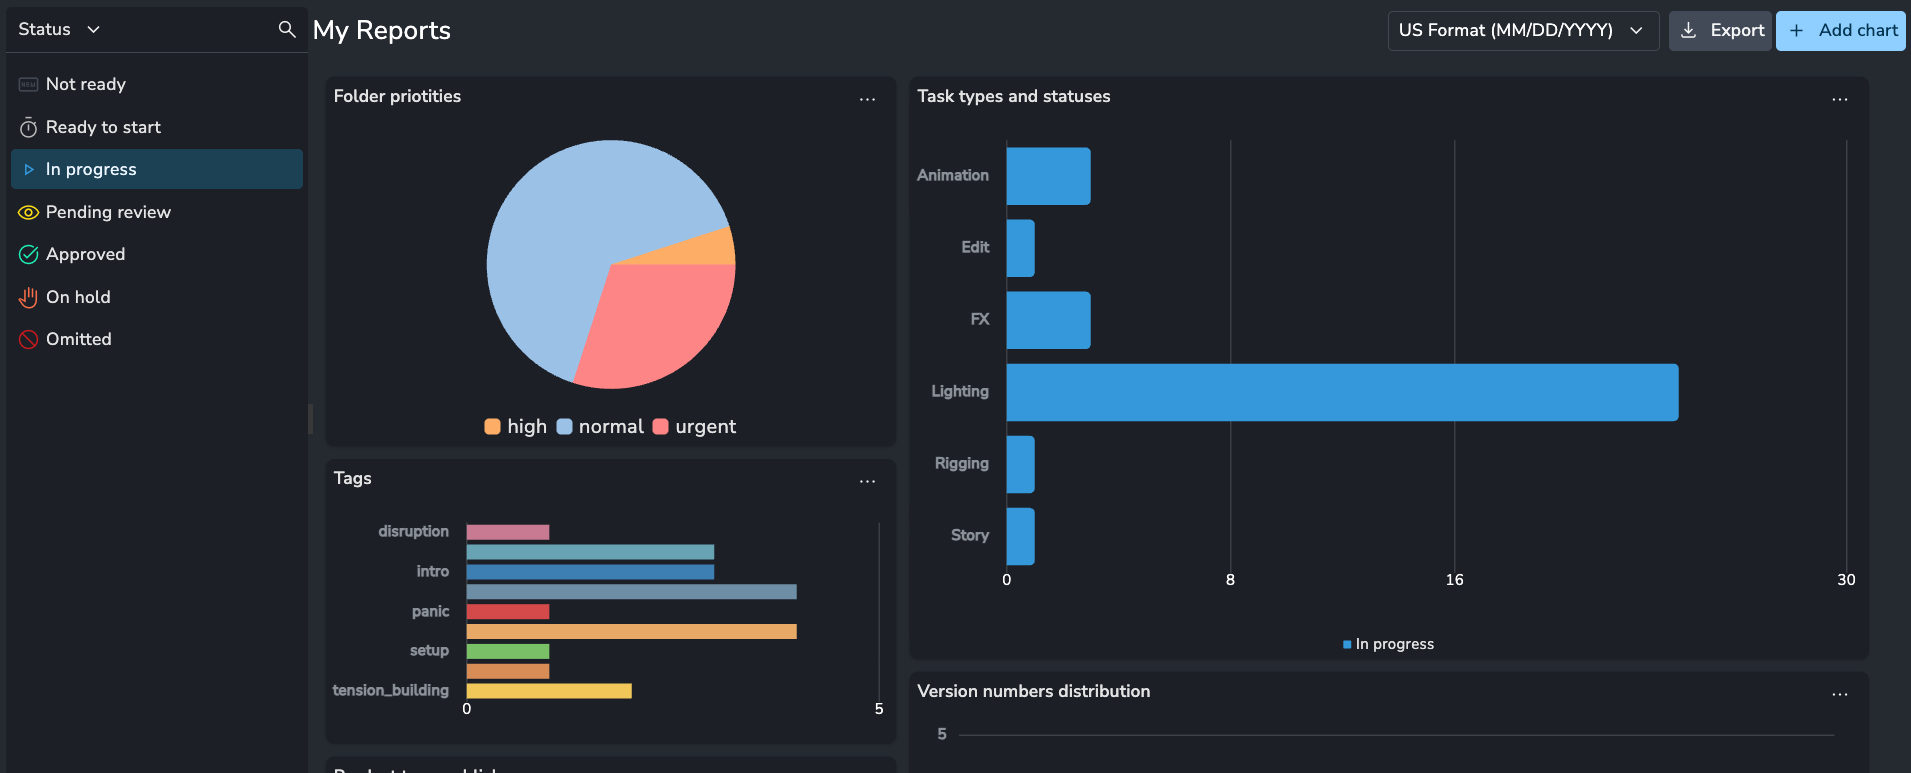
When you first access the page, you are presented with a default dashboard containing six example charts to demonstrate the addon's capabilities.
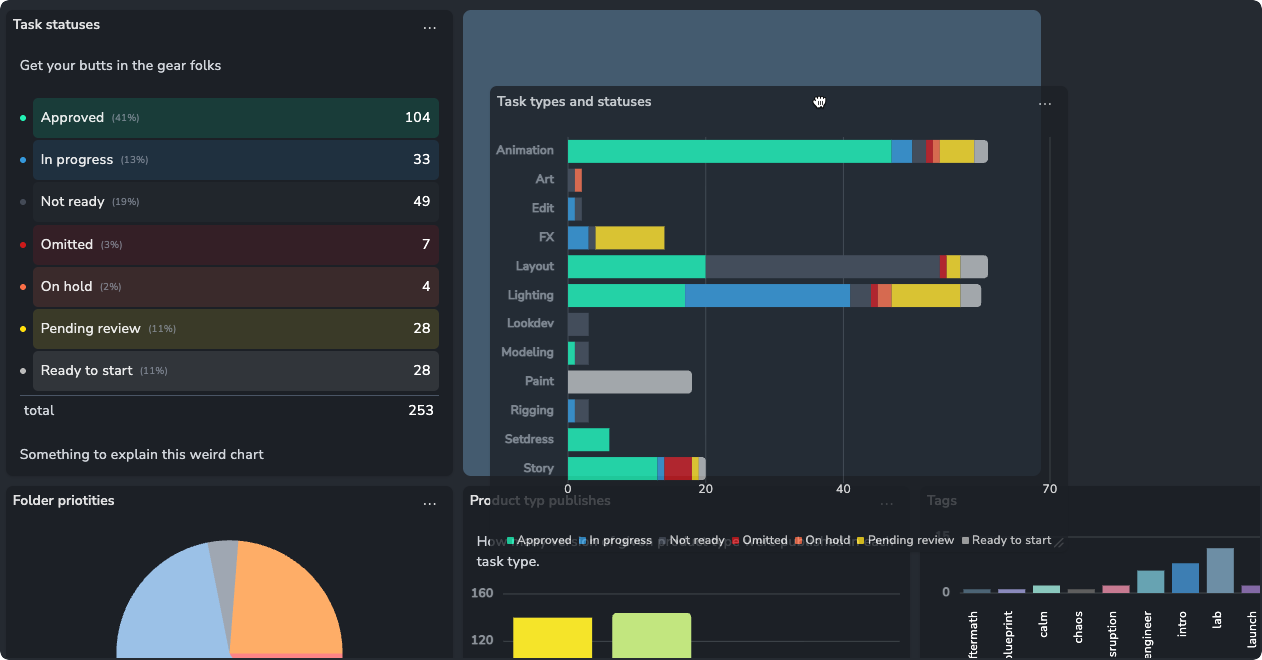
Managing the Layout
You can fully customize the dashboard layout:
Move Charts: Hover over the chart header until the hand icon appears, then click and drag the chart to a new position using the snapping grid.
Resize Charts: Hover over the bottom-right corner of a chart and drag to resize it to your preference.
Views
The Reports page supports Views , allowing you to save, manage, and share specific dashboard configurations
You can create multiple views for different purposes (e.g., a "Task Progress" view vs. a "Version Output" view).
Views can be customized, saved, and shared with other team members.
Creating Charts
To create a new chart, click the Add Chart button. You can choose from pre-made Templates for inspiration or select a Custom Chart to build one from scratch.
Chart Data Types
There are three fundamental types of data visualization logic you can choose from:
Current State: Shows a snapshot of the data as it exists at the present moment (e.g., "Total tasks today").
Historical Timeline: (Time Series) Tracks how data has changed over time. This is useful for visualizing trends, such as whether the number of active tasks is increasing or decreasing daily.
Attribute-Based Timeline: Plots data based on a specific date attribute on the entity, such as
created_ator a customdue_date. This allows you to see when specific events occurred or look into the future to identify upcoming bottlenecks (e.g., a spike in tasks due next week).
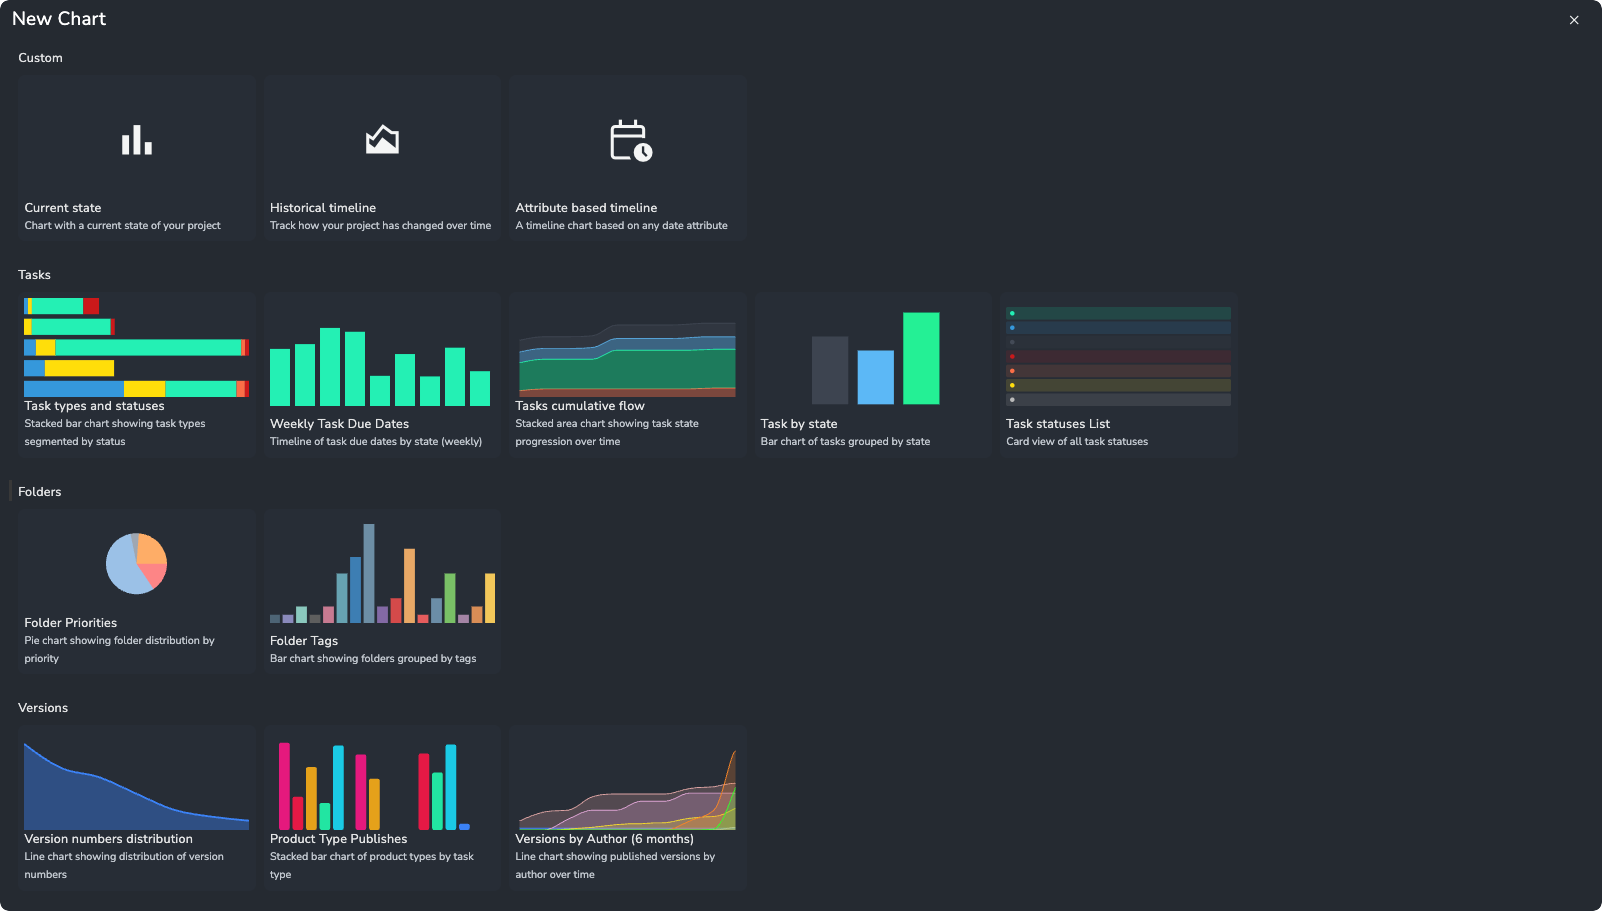
Chart Configuration
When editing a chart, you will see a preview in the center and configuration parameters on the right.
1. Data Source
Select the entity type you want to analyze. Currently supported sources are:
Tasks
Folders
Versions
2. Metrics
Currently, the metric is set to Count Records (e.g., total number of tasks). Future updates will allow for calculating totals or averages of attributes, such as budget.
3. Grouping
Determines how the data is categorized.
You can group by any attribute, such as Task Type, Status, or Assignee.
You can also group by Parent Attributes (e.g., grouping Tasks by their parent Folder's status or priority).
Colors & Icons: The charts automatically utilize the colors and icons defined in your Project Anatomy
Sorting: You can sort groups by default order, alphabetical name, or value (e.g., lowest to highest count).
Include Groups: Allows you to filter out specific groups you do not wish to see in the chart.

Creating a horizontal bar chart of Tags
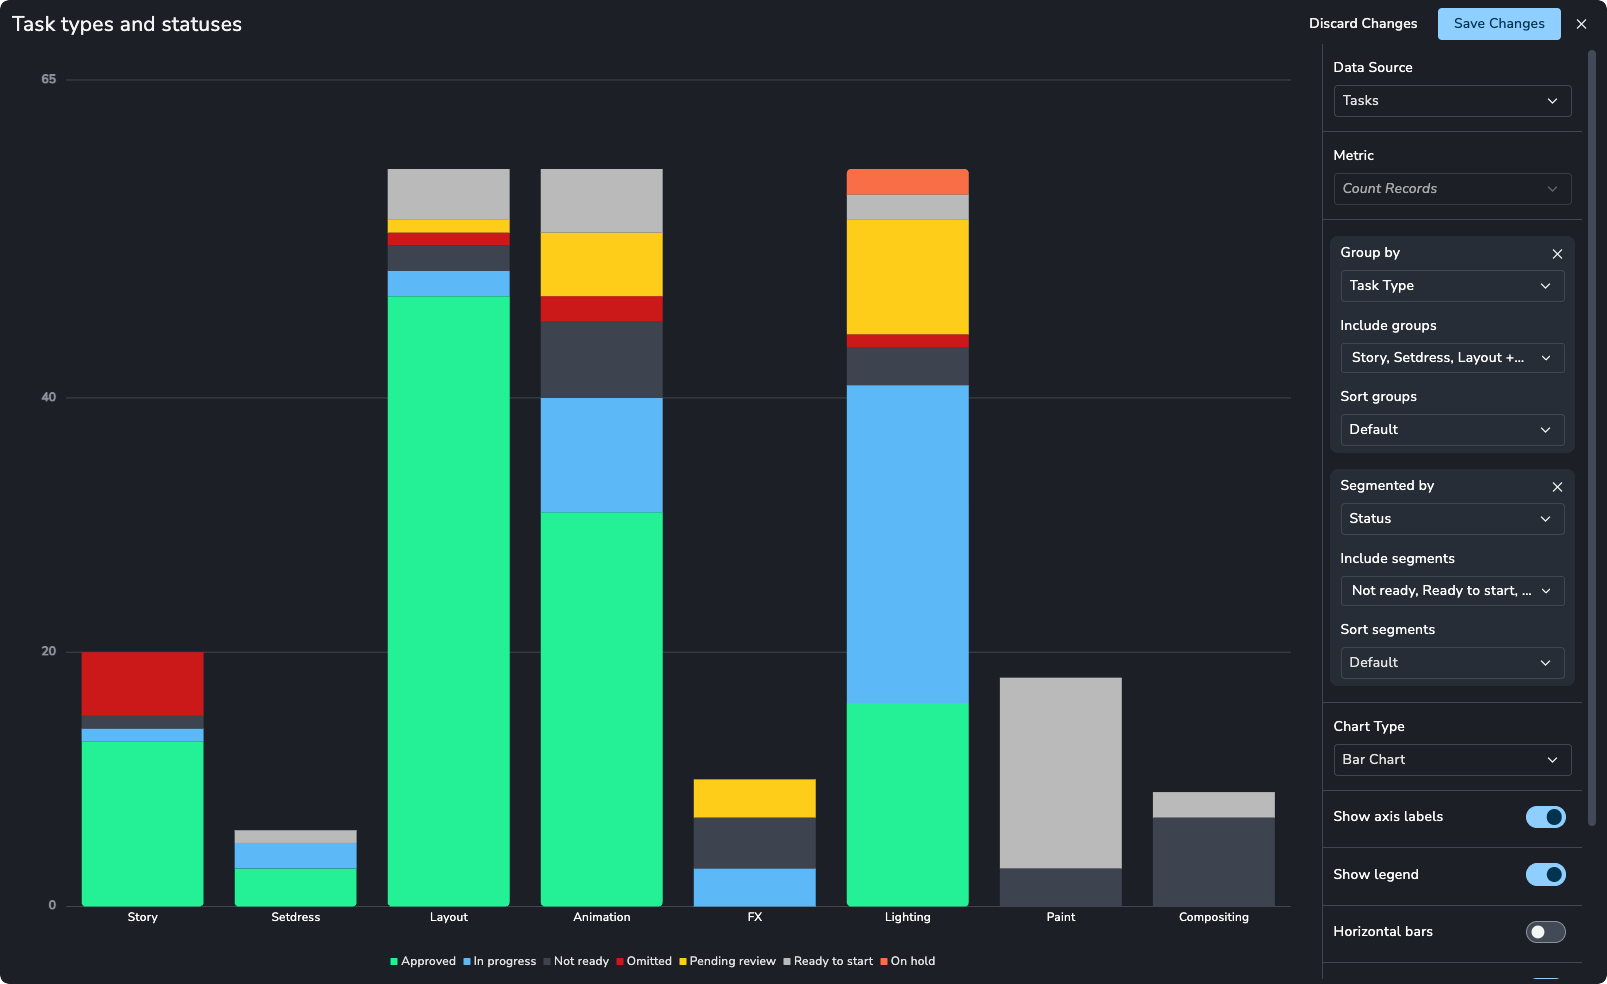
4. Segmenting
You can take grouping a step further by Segmenting. This creates sub-groups within your main groups.
Example: Create a bar chart grouped by Status, and then segmented by Task Type. This creates a stacked bar showing the breakdown of task types within each status column.
Visualization Options
Once the data is configured, you can adjust the cosmetic appearance of the chart.
Chart Types
Bar Chart: Standard bar graph. Supports stacking and horizontal orientation.
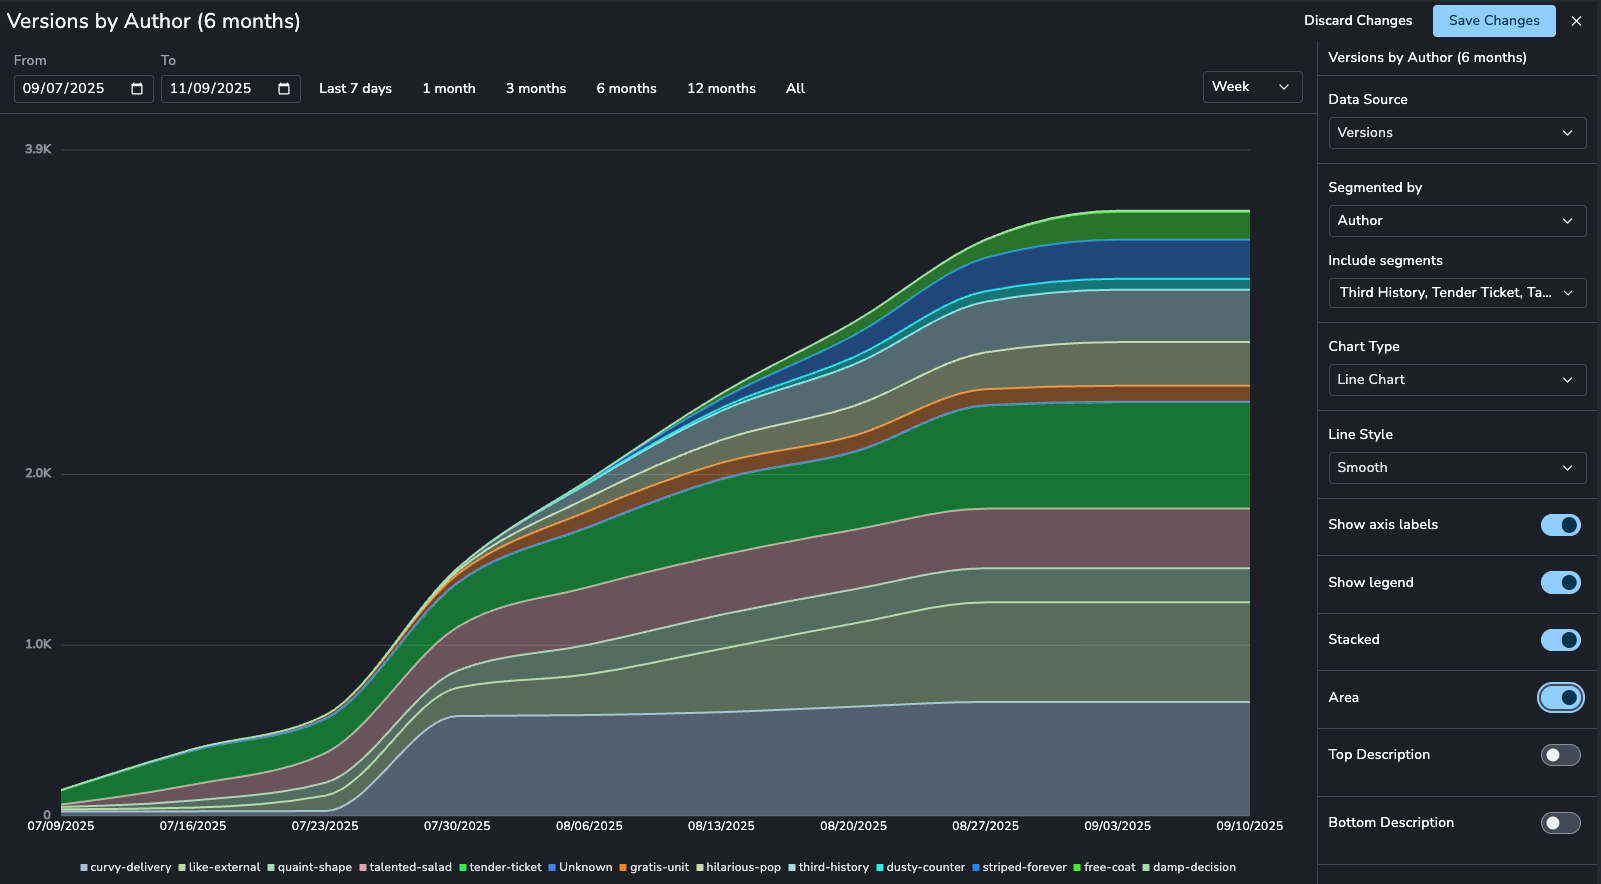
Line Chart: Best for time-based data. Includes options for line interpolation (smooth, jagged, stepped).
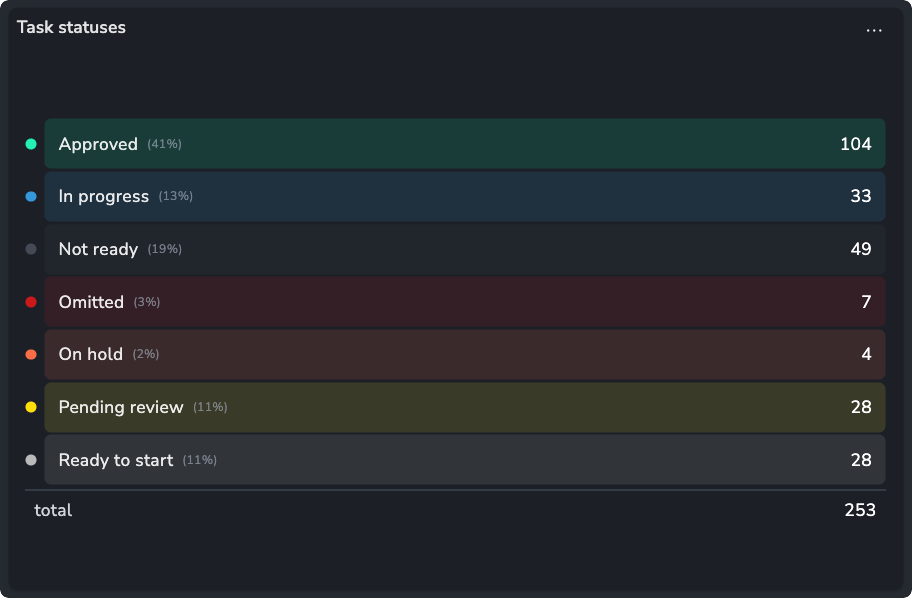
Pie Chart: Displays data as a percentage of the whole. Note: Does not support segmentation.
Card: Displays a single total number or percentage. Useful for high-level metrics (KPIs). Note: Supports grouping but not segmentation.
Display Options
Labels & Legends: Toggle axis labels and legends on or off.
Show Empty Groups: Choose whether to hide groups that have zero results (default) or display them.
Descriptions: Add top or bottom text descriptions to explain context or highlight importance.
Filtering and Slicing
The left-hand panel provides global filtering for the dashboard.
Hierarchy Slicer: Select specific parts of the project hierarchy (e.g., a specific Sequence or Shot). All charts will update to show data only for that selection and its children.
Attribute Slicers: Filter the entire dashboard by specific attributes such as Assignee, Status, or Task Type.
Exporting Reports
Exporting and Sharing Reports
You can share your insights by exporting the current view as a file or by quickly copying data for external use. Click the Export button in the top header to access these options.
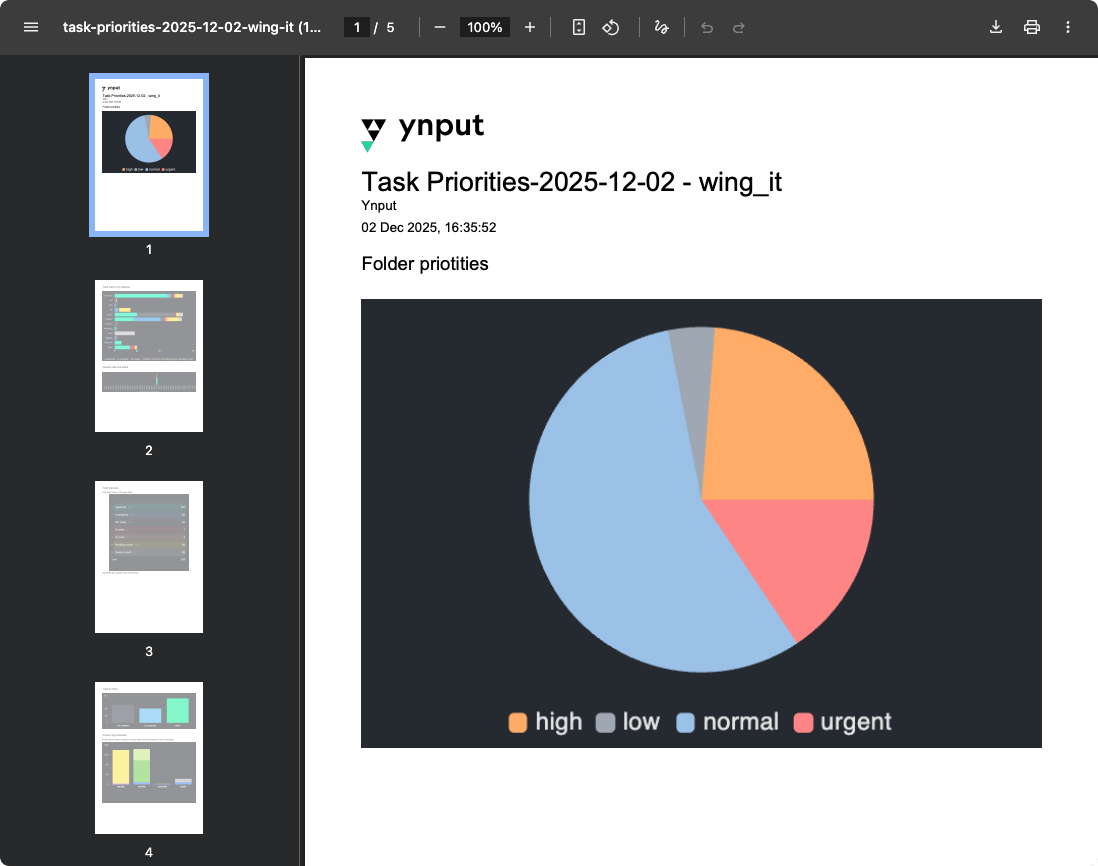
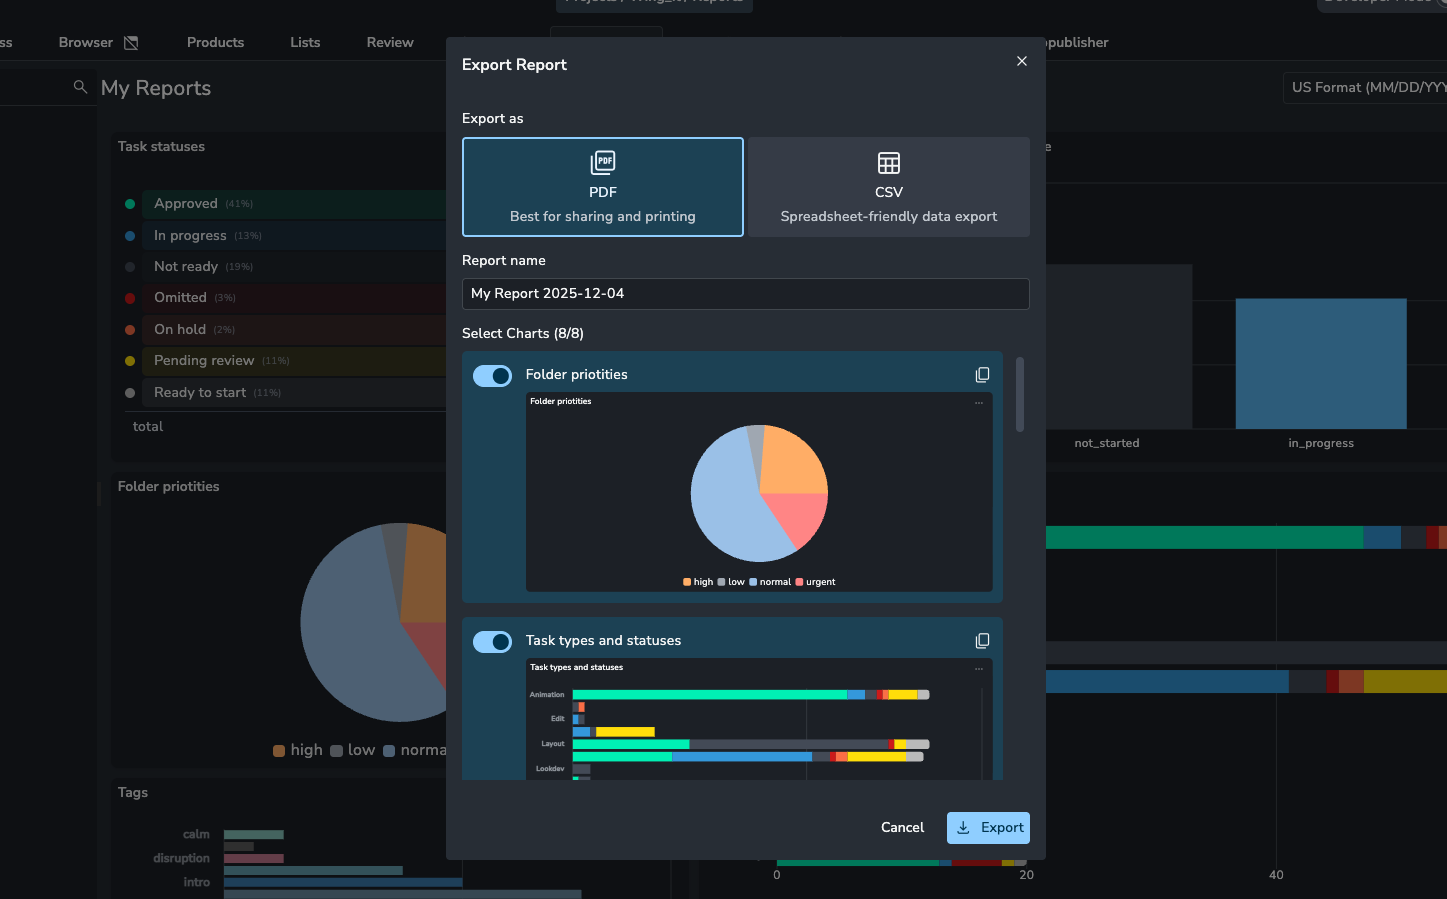
Export as PDF
Generates a polished document suitable for presentations or archiving.
Report Name: Defaults to the View name plus the current date to ensure uniqueness.
Select Charts: A preview window allows you to select or deselect specific charts to include in the PDF.
Branding: The generated PDF includes your Studio Logo at the top for a professional look.Export as CSV
Export as CSV
Download the underlying raw data for further analysis in external tools.
Select Export CSV to generate a file containing the data points from your currently visible charts.
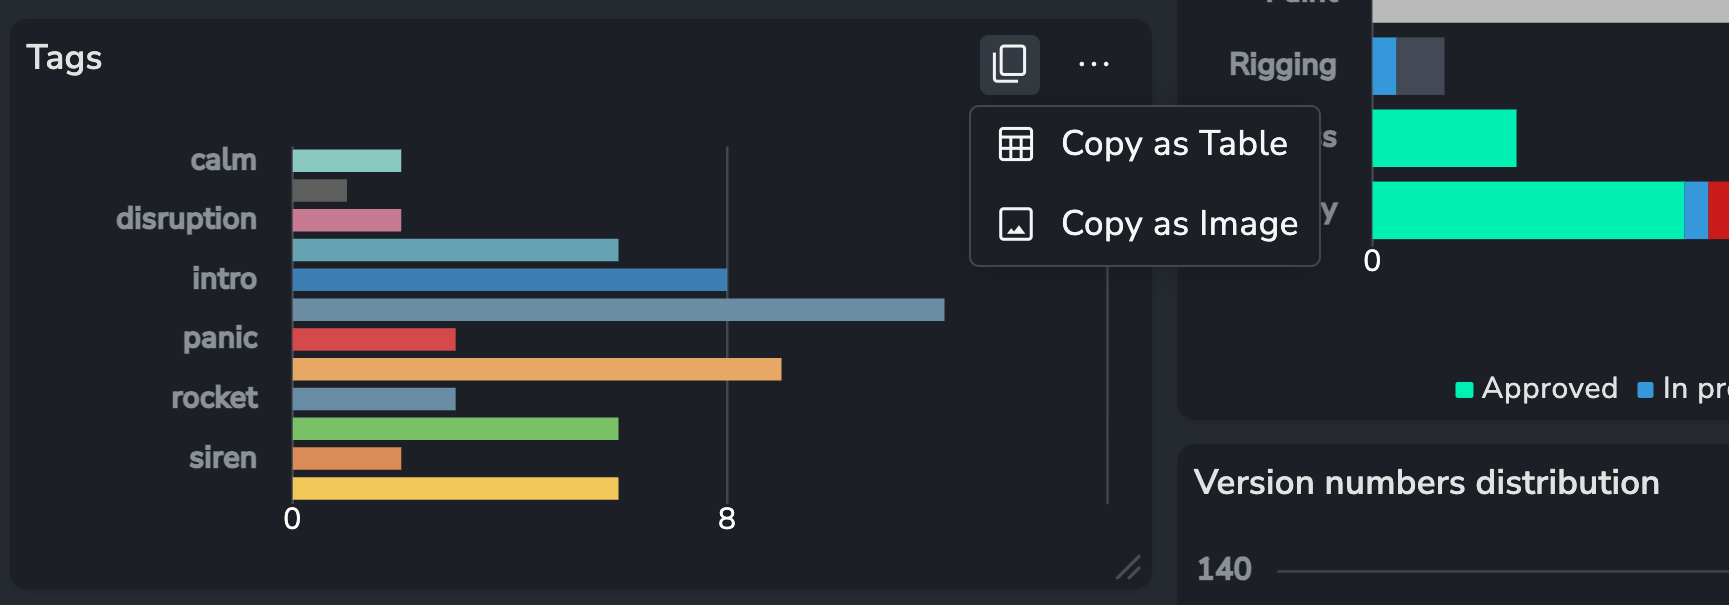
Copy to Clipboard
You can quickly share individual charts without generating a full file:
Copy Chart Image: Copy the visual representation of the chart as an image to your clipboard. This is ideal for pasting into chat applications or slide decks.
Copy Chart Data: Copy the chart's raw values to your clipboard, formatted to be pasted directly into spreadsheet software (like Excel or Google Sheets).